
How to create multi color bar graph using ChartJS
ChartJS
In this tutorial we will learn to draw multicolor bar graph using ChartJS and some static data.
Using ChartJS 2.x Download
In the previous tutorial we have covered how to draw bar graph using static data. In this tutorial we will use different colors for the bar graph.
You will find the code in my chartjs2 GitHub repository.
Project structure
We will start with the following project structure.
Now, inside the css folder we will create a default.css file. Inside the js folder we will create a bar-multicolor.js file. And inside the project folder we will create a bar-multicolor.html file.
bar-multicolor.html
Inside the head we are including the default.css file which will style the graph.
Inside the body we have a canvas element having id bar-chartcanvas. We will draw the bar graph inside this canvas.
At the end of the file before the closing body tag we are including jquery.min.js then Chart.min.js and then bar-multicolor.js javascript files.
<!DOCTYPE html>
<html>
<head>

  <title>ChartJS - Multicolor Bar graph</title>
  <link href="css/default.css" rel="stylesheet">

</head>
<body>

  <div class="chart-container">
    <canvas id="bar-chartcanvas"></canvas>
  </div>

  <!-- javascript -->
  <script src="js/jquery.min.js"></script>
  <script src="js/Chart.min.js"></script>
  <script src="js/bar-multicolor.js"></script>

</body>
</html>
default.css
This file contains the some style rules to style the chart.
.chart-container {
  width:  80%;
  height: 480px;
  margin: 0 auto;
}
bar-multicolor.js
In this file we have the logic to create a bar graph using ChartJS and static data.
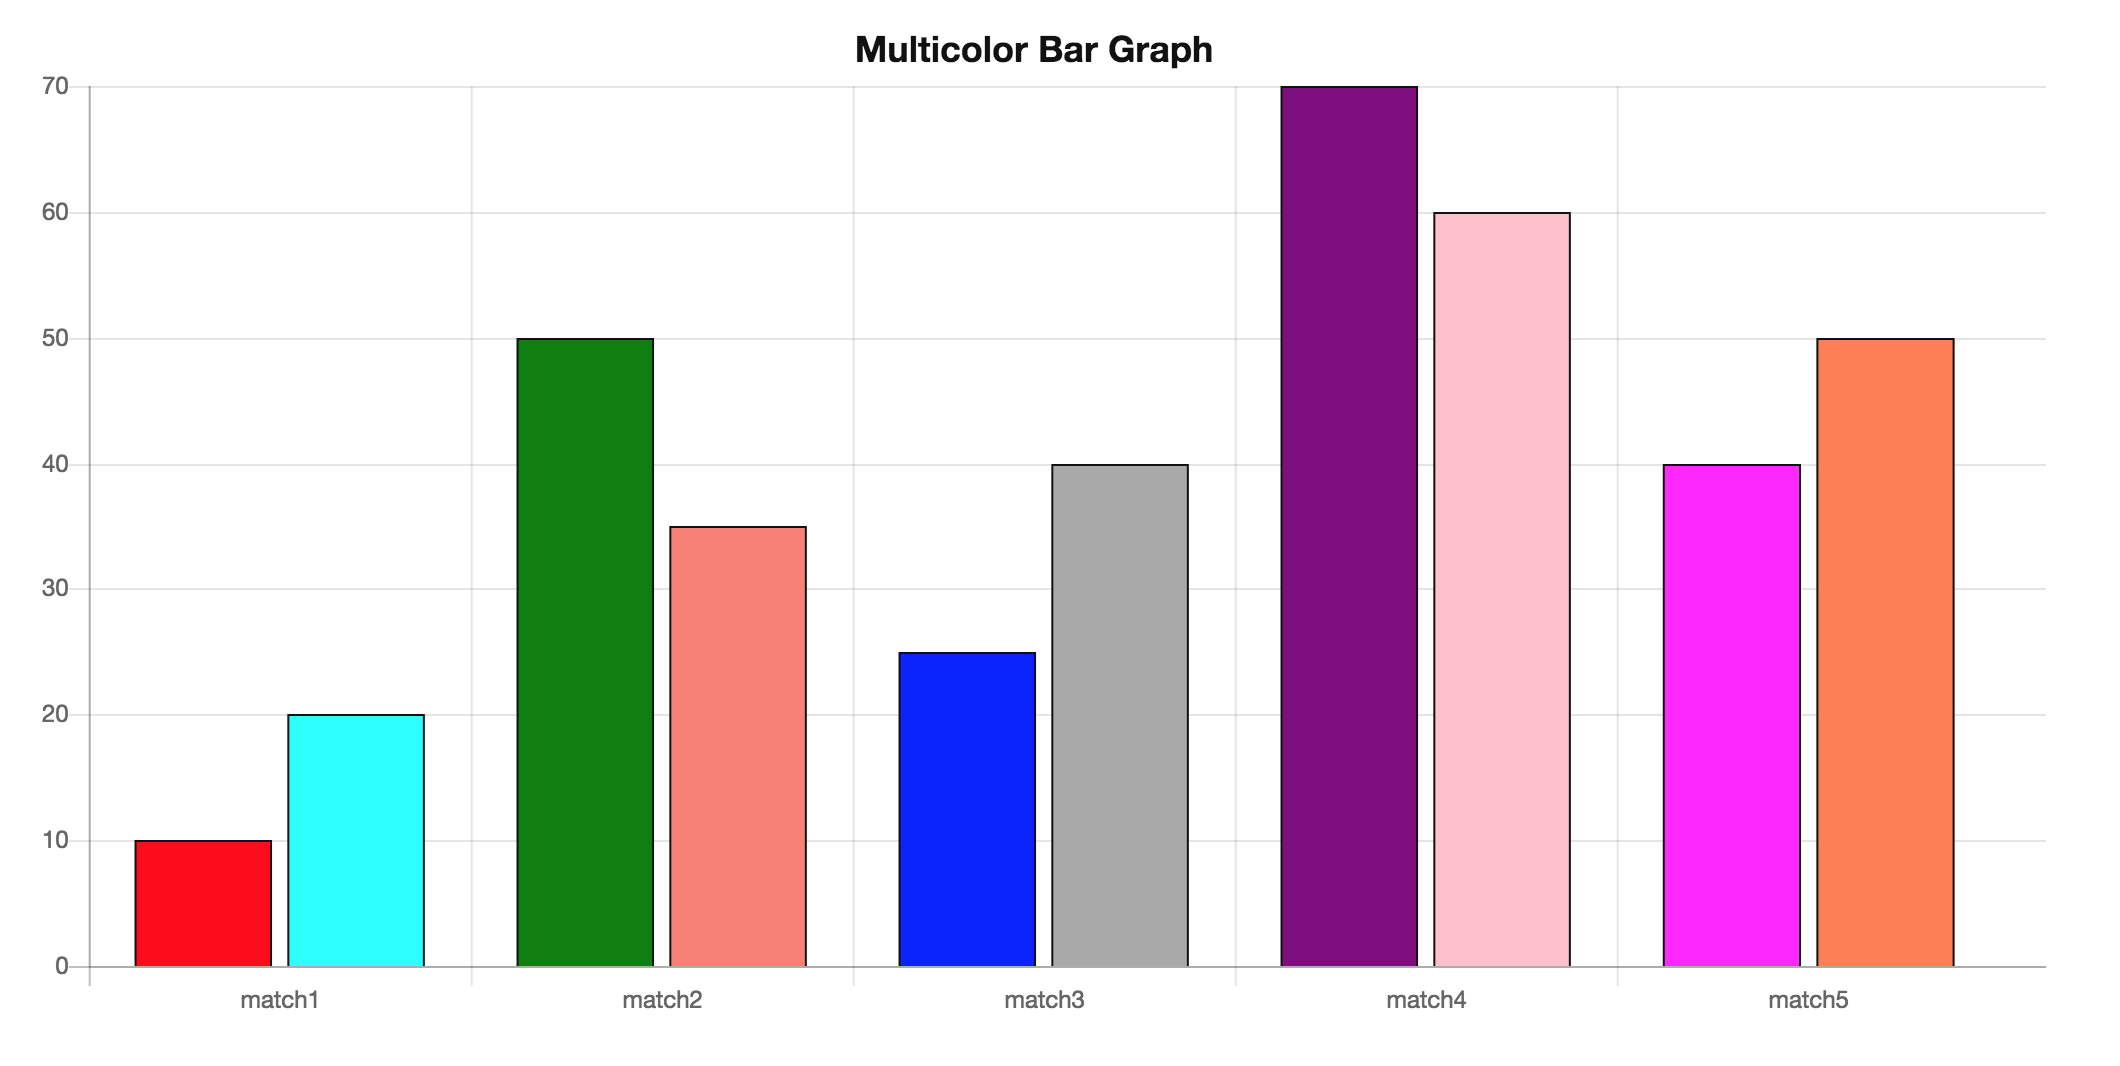
In this example we have score of two teams TeamA score and TeamB score for 5 matches namely match1, match2, ... match5.
For different color we set the backgroundColor property to an array of color.
$(document).ready(function () {

  var ctx = $("#bar-chartcanvas");

  var data = {
    labels : ["match1", "match2", "match3", "match4", "match5"],
    datasets : [
      {
        label : "TeamA score",
        data : [10, 50, 25, 70, 40],
        backgroundColor : [
          "red", "green", "blue", "purple", "magenta"
        ],
        borderColor : [
          "#111", "#111", "#111", "#111", "#111"
        ],
        borderWidth : 1
      },
      {
        label : "TeamB score",
        data : [20, 35, 40, 60, 50],
        backgroundColor : [
          "aqua", "salmon", "darkgray", "pink", "coral"
        ],
        borderColor : [
          "#111", "#111", "#111", "#111", "#111"
        ],
        borderWidth : 1
      }
    ]
  };

  var options = {
    title : {
      display : true,
      position : "top",
      text : "Bar Graph",
      fontSize : 18,
      fontColor : "#111"
    },
    legend : {
      display : false
    },
    scales : {
      yAxes : [{
        ticks : {
          min : 0
        }
      }]
    }
  };

  var chart = new Chart( ctx, {
    type : "bar",
    data : data,
    options : options
  });

});
Output
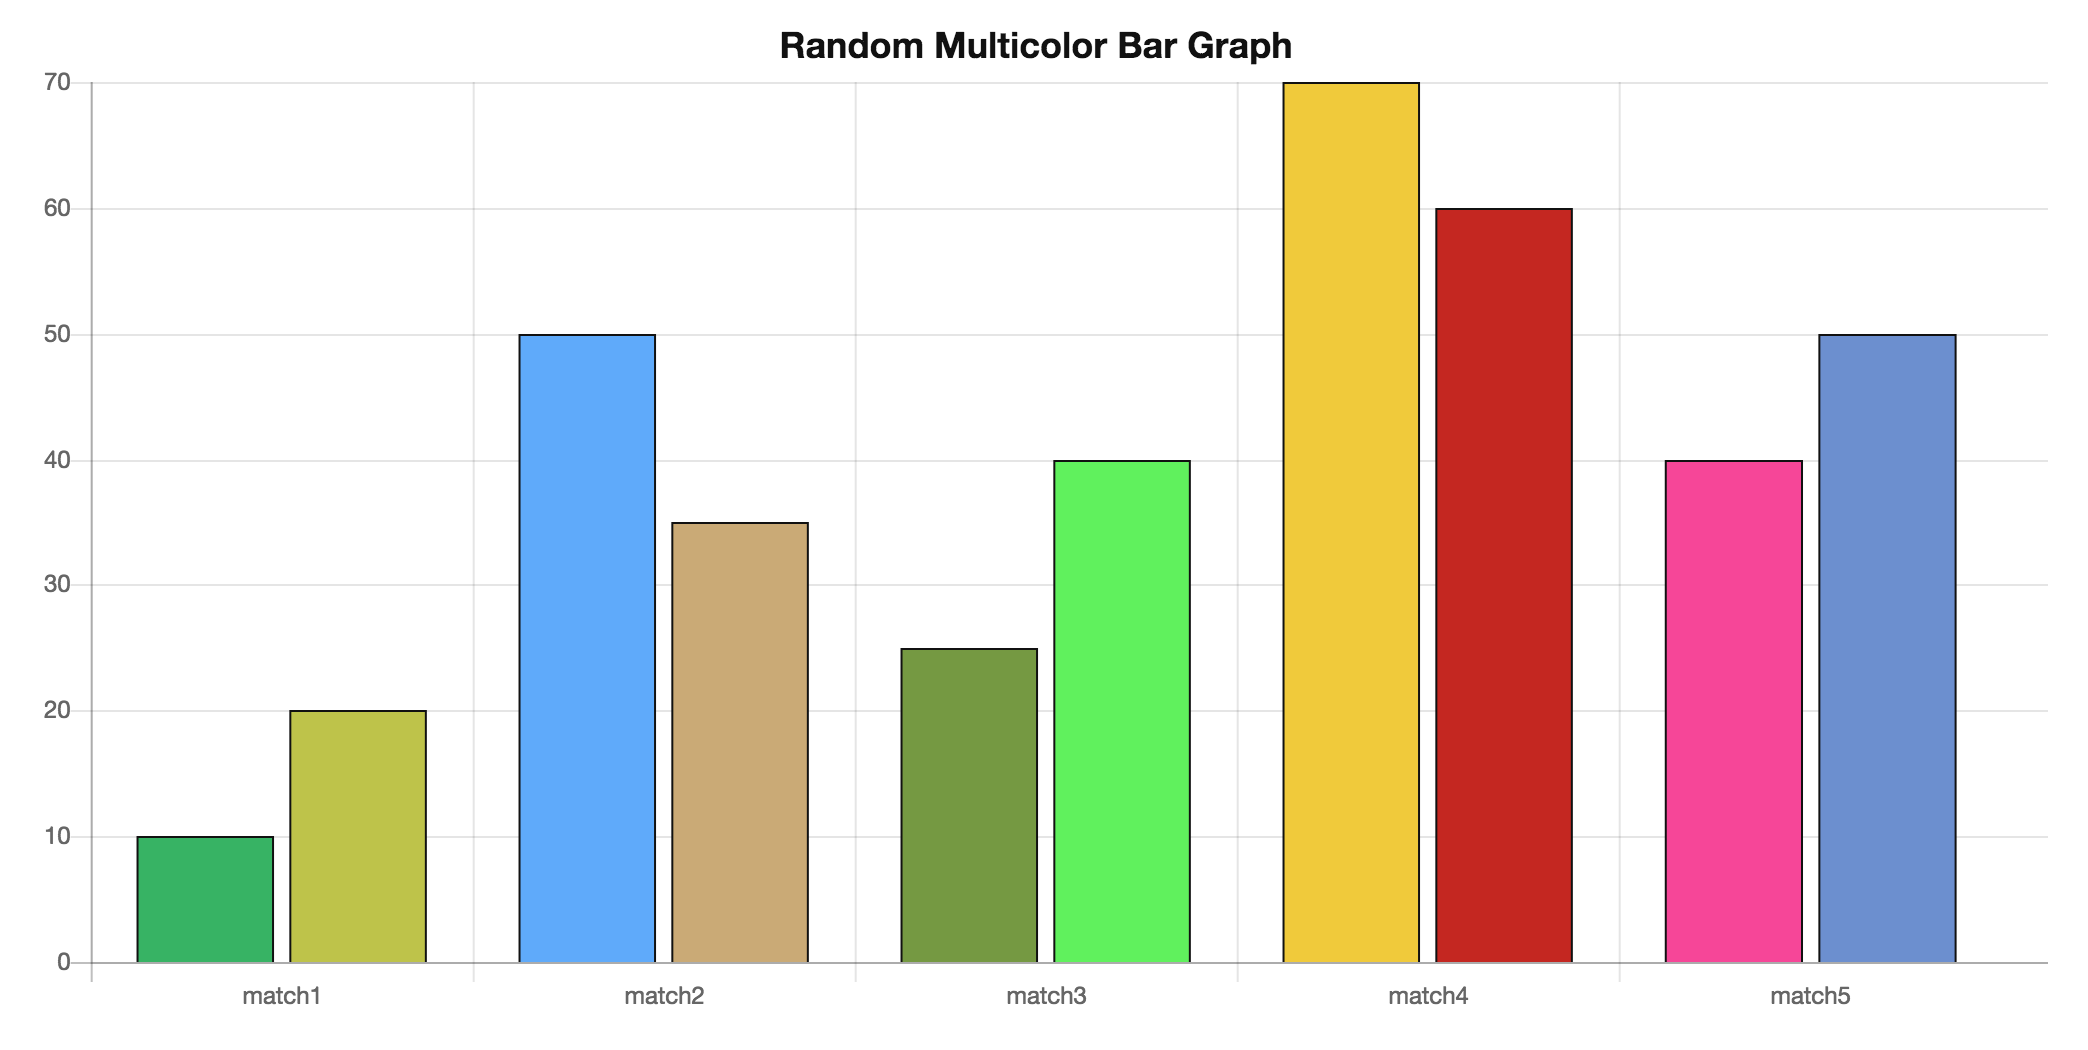
Random multicolor bar graph
To get random multicolor bar graph each time we load the page we are using the getRandomColorHex() function. This function returns color in hex form like #0011AA.
$(document).ready(function () {

  var ctx = $("#bar-chartcanvas");

  var data = {
    labels : ["match1", "match2", "match3", "match4", "match5"],
    datasets : [
      {
        label : "TeamA score",
        data : [10, 50, 25, 70, 40],
        backgroundColor : [
          getRandomColorHex(),
          getRandomColorHex(),
          getRandomColorHex(),
          getRandomColorHex(),
          getRandomColorHex()
        ],
        borderColor : [
          "#111",
          "#111",
          "#111",
          "#111",
          "#111"
        ],
        borderWidth : 1
      },
      {
        label : "TeamB score",
        data : [20, 35, 40, 60, 50],
        backgroundColor : [
          getRandomColorHex(),
          getRandomColorHex(),
          getRandomColorHex(),
          getRandomColorHex(),
          getRandomColorHex()
        ],
        borderColor : [
          "#111",
          "#111",
          "#111",
          "#111",
          "#111"
        ],
        borderWidth : 1
      }
    ]
  };

  var options = {
    title : {
      display : true,
      position : "top",
      text : "Random Multicolor Bar Graph",
      fontSize : 18,
      fontColor : "#111"
    },
    legend : {
      display : false
    },
    scales : {
      yAxes : [{
        ticks : {
          min : 0
        }
      }]
    }
  };

  var chart = new Chart( ctx, {
    type : "bar",
    data : data,
    options : options
  });

  /**
   * function to generate random color in hex form
   */
  function getRandomColorHex() {
    var hex = "0123456789ABCDEF",
        color = "#";
    for (var i = 1; i <= 6; i++) {
      color += hex[Math.floor(Math.random() * 16)];
    }
    return color;
  }

});
Output
ADVERTISEMENT