
Getting Started
ChartJS
Hello I am Yusuf Shakeel and in this tutorial we will learn about ChartJS which is a simple yet flexible JavaScript charting for designers & developers.
Before we start here are the list of things that we will need.
- Web Browser
- Text Editor or IDE for writing code
- ChartJS
- jQuery
Web browser: Any one of the following web browser will be fine - Chrome, Firefox, Safari, Edge and IE.
Text Editor: You can use any of the following text editors - Notepad++, Brackets, Atom or SublimeText.
IDE: I prefer using eclipse and NetBeans but you can use any other IDE of your choice.
ChartJS: Download ChartJS latest release version from their GitHub repository. Click here to get the latest release.
jQuery: We will also need jQuery which can be downloaded from jquery.com. We will be using v1.12 for this tutorial and you can get it here.
Important links
The ChartJS documentation is here.
The code we will cover in this tutorial are there in my GitHub repository.
chartjs for version 1.x
chartjs2 for version 2.x
My YouTube tutorial videos playlist on ChartJS.
My YouTube tutorial videos playlist on ChartJS 2.x.
Using ChartJS 2.x Download
Things I will be using for this tutorial
For this tutorial I will be using Chrome browser and SublimeText.
Project structure
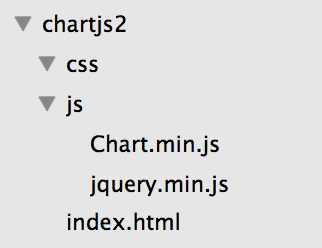
First we will create a new project folder and we will name it as chartjs2. Now inside this project folder we will create two more folders namely css and js. The css folder will hold stylesheet files and the js folder will hold the javascript files. Now we will copy jquery.js and chart.js file inside the js folder. And finally we will create an index.html file inside the project folder.
At this moment our project structure will look like the following.
index.html
In the index.html code we will write the basic html structure and include jquery and then chartjs javascript files at the end of the body.
<!DOCTYPE html>
<html>
<head>
    <title>ChartJS</title>
</head>
<body>

    <!-- javascript -->
    <script src="js/jquery.min.js"></script>
    <script src="js/Chart.min.js"></script>
</body>
</html>
Create a canvas to draw a chart
Now inside the body create the following canvas element having id attribute set to chartcanvas, width set to 720 and height set to 480.
<canvas width="720" height="480" id="chartcanvas"></canvas>
Now some JavaScript
To draw the chart we need to create an instance of the Chart class and pass the node of the canvas element.
In the following code we are getting the context of the canvas that we created above and then instantiating the Chart class and pass the context and data object to it.
//get the canvas
var ctx = $("#chartcanvas");

//instantiate the Chart class
var chart = new Chart(ctx, {
  type : "line",
  data : {},
  options: {
    responsive : true
  }
});
Final look
At this moment our index.html file will look like the following. Note! We will not get any chart yet. We will cover the drawing of different charts in later part of this tutorial.
<!DOCTYPE html>
<html>
<head>
    <title>ChartJS</title>
</head>
<body>
    <canvas width="720" height="480" id="chartcanvas"></canvas>

    <!-- javascript -->
    <script src="js/jquery.min.js"></script>
    <script src="js/Chart.min.js"></script>

    <script type="text/javascript">
    //get the canvas
    var ctx = $("#chartcanvas");

    //instantiate the Chart class
    var chart = new Chart(ctx, {
      type : "line",
      data : {},
      options: {
        responsive : true
      }
    });
    </script>
</body>
</html>
ADVERTISEMENT