
ChartJS | How to create Doughnut Chart using data from MySQL (MariaDB) table and PHP
ChartJS
In this tutorial we will learn to create doughnut chart using data from MySQL (MariaDB) table and PHP.
Using ChartJS 2.x Download
Note! You can get the code of this tutorial from my GitHub repository.
Task
Our task is to create doughnut chart for two teams - TeamA and TeamB. The doughnut chart will show the scores of the teams in 5 matches namely match1, match2, ..., match5.
Prerequisite
A localhost development environment for PHP. If you are using Microsoft Windows then you can use XAMPP. If you are using Apple macOS then you can use MAMP.
Both XAMPP and MAMP will have PHP and MySQL (MariaDB) so you don't have to install them separately.
Here are some of my YouTube tutorial video on XAMPP and PHP IDE setup.
PHP | How to setup XAMPP and Zend Eclipse PDT for PHP project
PHP | How to setup XAMPP and NetBeans for PHP project
XAMPP | How to setup XAMPP Apache Port Number
htdocs
Once you have the development environment ready you need to place the chartjs2 project in the public folder of your localhost. This public folder is generally named htdocs.
Project structure
We will start with the following project structure.
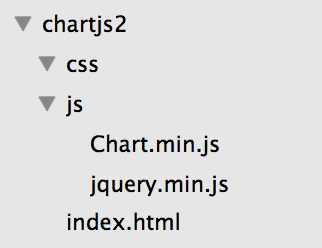
We have a css folder containing stylesheet files. And we have a js folder containing some javascript files.
Backend
The backend part is same as the this tutorial - ChartJS | How to draw Line graph using data from MySQL table and PHP
Frontend
Now its time for us to work on the frontend part.
In the project folder chartjs2 create a new html file and inside the js folder create a new js file. I will name the html file as doughnut-db-php.html and js file as doughnut-db-php.js.
At this point the project structure will look like the following.
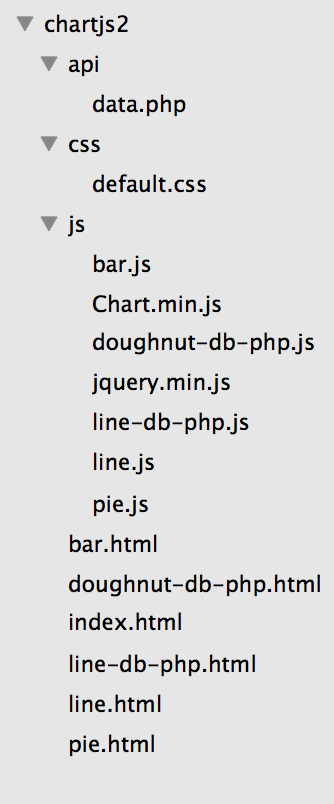
Note! Other files shown in the above image are from my different ChartJS tutorial.
HTML
Open doughnut-db-php.html file and write the following.
<!DOCTYPE html>
<html>
<head>
  <title>ChartJS - Doughnut</title>

  <link href="css/default.css" rel="stylesheet">

</head>
<body>

  <div class="chart-container">
  <div class="doughnut-chart-container">
    <canvas id="doughnut-chartcanvas-1"></canvas>
  </div>

  <div class="doughnut-chart-container">
    <canvas id="doughnut-chartcanvas-2"></canvas>
  </div>
  </div>

  <!-- javascript -->
  <script src="js/jquery.min.js"></script>
  <script src="js/Chart.min.js"></script>

  <script src="js/doughnut-db-php.js"></script>

</body>
</html>
JavaScript
Now open the doughnut-db-php.js file and write the following code.
$(document).ready(function() {

  /**
   * call the data.php file to fetch the result from db table.
   */
  $.ajax({
    url : "http://localhost/chartjs2/api/data.php",
    type : "GET",
    success : function(data){
      console.log(data);

      var score = {
        TeamA : [],
        TeamB : []
      };

      var len = data.length;

      for (var i = 0; i < len; i++) {
        if (data[i].team == "TeamA") {
          score.TeamA.push(data[i].score);
        }
        else if (data[i].team == "TeamB") {
          score.TeamB.push(data[i].score);
        }
      }

      var ctx1 = $("#doughnut-chartcanvas-1");
      var ctx2 = $("#doughnut-chartcanvas-2");

      var data1 = {
        labels : ["match1", "match2", "match3", "match4", "match5"],
        datasets : [
          {
            label : "TeamA score",
            data : score.TeamA,
            backgroundColor : [
                        "#DEB887",
                        "#A9A9A9",
                        "#DC143C",
                        "#F4A460",
                        "#2E8B57"
                    ],
                    borderColor : [
                        "#CDA776",
                        "#989898",
                        "#CB252B",
                        "#E39371",
                        "#1D7A46"
                    ],
                    borderWidth : [1, 1, 1, 1, 1]
          }
        ]
      };

      var data2 = {
        labels : ["match1", "match2", "match3", "match4", "match5"],
        datasets : [
          {
            label : "TeamB score",
            data : score.TeamB,
            backgroundColor : [
                        "#FAEBD7",
                        "#DCDCDC",
                        "#E9967A",
                        "#F5DEB3",
                        "#9ACD32"
                    ],
                    borderColor : [
                        "#E9DAC6",
                        "#CBCBCB",
                        "#D88569",
                        "#E4CDA2",
                        "#89BC21"
                    ],
                    borderWidth : [1, 1, 1, 1, 1]
          }
        ]
      };

      var options = {
        title : {
          display : true,
          position : "top",
          text : "Doughnut Chart",
          fontSize : 18,
          fontColor : "#111"
        },
        legend : {
          display : true,
          position : "bottom"
        }
      };


      var chart1 = new Chart( ctx1, {
        type : "doughnut",
        data : data1,
        options : options
      });

      var chart2 = new Chart( ctx2, {
        type : "doughnut",
        data : data2,
        options : options
      });

    },
    error : function(data) {
      console.log(data);
    }
  });

});
ADVERTISEMENT