
How to create a pie chart using ChartJS
ChartJS
In this tutorial we will learn to draw pie chart using ChartJS and some static data.
Using ChartJS 2.x Download
Note! You can get the code of this tutorial from my GitHub repository.
Task
We will create a pie chart for two teams namely, TeamA and TeamB and their score for 5 matches - match1, match2, ... match5.
Project structure
We will start with the following project structure.
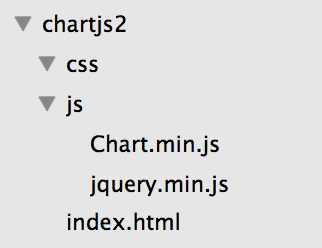
Inside the css folder we will create a default.css file. This will contain the default stylesheet.
And inside the js folder we will create pie.js file. In this file we will be writing the code to create the pie graphs.
And inside the project folder we will create a pie.html file.
Now the project structure will look like the following.
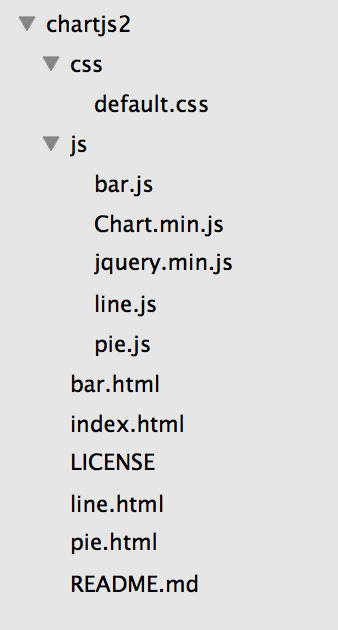
There are some other files shown in the above image from my other tutorials.
pie.html
Copy the HTML structure from the index.html file and make sure you have the jQuery and ChartJS javascript files included.
Now in the head include the default.css file that we created and saved in the css folder.
Inside the body create a div and give it a class chart-container. Inside this we create two divs having class .pie-chart-container. And inside each of these divs create a canvas and give them respective id pie-chartcanvas-1 and pie-chartcanvas-2.
And lastly before closing of the body tag include the pie.js javascript file that we created inside the js folder.
So, now our pie.html file will look like the following.
<!DOCTYPE html>
<html>
<head>
  <title>ChartJS - Pie</title>
  <link type="text/css" rel="stylesheet" href="css/default.css" />
</head>
<body>
  <div class="chart-container">
    <div class="pie-chart-container">
      <canvas id="pie-chartcanvas-1"></canvas>
    </div>

    <div class="pie-chart-container">
      <canvas id="pie-chartcanvas-2"></canvas>
    </div>
  </div>

  <!-- javascript -->
  <script src="js/jquery.min.js"></script>
  <script src="js/Chart.min.js"></script>
  <script src="js/pie.js"></script>
</body>
</html>
default.css
The default.css file will contain the following.
.chart-container {
  width: 80%;
  height: 480px;
  margin: 0 auto;
}

.pie-chart-container {
  height: 360px;
  width: 360px;
  float: left;
}
In the above code we are setting the width, height and margin of the .chart-container class and for the .pie-chart-container we are setting the width and height to 360px and placing them side-by-side by setting float to left.
JavaScript
To draw the pie chart we will write some javascript.
Canvas
First we will get the two canvas using their respective ids pie-chartcanvas-1 and pie-chartcanvas-2 by writing the following code.
//get the pie chart canvas
var ctx1 = $("#pie-chartcanvas-1");
var ctx2 = $("#pie-chartcanvas-2");
Options
Now we will define options for the chart. For this we will create an options object variable and set its responsive, title and legend.
This is similar to the line graph options and you can refer the line graph tutorial.
We will set responsive to true to make the graph responsive.
To create title for the pie graph we will set the following for the title data object.
- display: we set this to
truein order to make the title appear. - position: we set this to
topin order to make the title appear at the top of the pie graph. - text: this is set to
Pie Chart - fontSize: this controls the font size of the title.
- fontColor: this controls the font color of the title.
To create legend for the pie chart we set the legend property.
- display: this is set to
trueto display the legend. - position: this is set to
bottomwhich defines the position of the legend. - label: this is for the legend font color and size.
You can check the ChartJS documentation and set some other properties as well. But for this tutorial we will stick to the above mentioned properties.
So, the options will look like the following.
//options
var options = {
  responsive: true,
  title: {
    display: true,
    position: "top",
    text: "Pie Chart",
    fontSize: 18,
    fontColor: "#111"
  },
  legend: {
    display: true,
    position: "bottom",
    labels: {
      fontColor: "#333",
      fontSize: 16
    }
  }
};
Data
Now its time to create two data variables data1 and data2 that will hold the score of the two teams - TeamA and TeamB for the 5 matches respectively.
- labels: this is an array containing the match name.
- datasets: this is an array of two objects, one for each team score.
Each object element of the datasets contains the following properties.
- label: the label to be shown when the mouse hovers the pie.
- data: an array containing the scores for each match.
- backgroundColor: an array of hex value or color name for the pie segments.
- borderColor: an array of hex value or color name for the pie segments.
- borderWidth: this is for the border width of the pie segments.
Instantiate the Chart class
We create two variables chart1 and chart2 and instantiate the Chart class. We pass ctx1 and ctx2 which holds the canvas and the data object.
The data object contains the type property set to pie, data property set to data variable and the options property set to options.
You can also check out Color Mixer on this website.
Our final code for the pie.js file
$(function(){

  //get the pie chart canvas
  var ctx1 = $("#pie-chartcanvas-1");
  var ctx2 = $("#pie-chartcanvas-2");

  //pie chart data
  var data1 = {
    labels: ["match1", "match2", "match3", "match4", "match5"],
    datasets: [
      {
        label: "TeamA Score",
        data: [10, 50, 25, 70, 40],
        backgroundColor: [
          "#DEB887",
          "#A9A9A9",
          "#DC143C",
          "#F4A460",
          "#2E8B57"
        ],
        borderColor: [
          "#CDA776",
          "#989898",
          "#CB252B",
          "#E39371",
          "#1D7A46"
        ],
        borderWidth: [1, 1, 1, 1, 1]
      }
    ]
  };

  //pie chart data
  var data2 = {
    labels: ["match1", "match2", "match3", "match4", "match5"],
    datasets: [
      {
        label: "TeamB Score",
        data: [20, 35, 40, 60, 50],
        backgroundColor: [
          "#FAEBD7",
          "#DCDCDC",
          "#E9967A",
          "#F5DEB3",
          "#9ACD32"
        ],
        borderColor: [
          "#E9DAC6",
          "#CBCBCB",
          "#D88569",
          "#E4CDA2",
          "#89BC21"
        ],
        borderWidth: [1, 1, 1, 1, 1]
      }
    ]
  };

  //options
  var options = {
    responsive: true,
    title: {
      display: true,
      position: "top",
      text: "Pie Chart",
      fontSize: 18,
      fontColor: "#111"
    },
    legend: {
      display: true,
      position: "bottom",
      labels: {
        fontColor: "#333",
        fontSize: 16
      }
    }
  };

  //create Chart class object
  var chart1 = new Chart(ctx1, {
    type: "pie",
    data: data1,
    options: options
  });

  //create Chart class object
  var chart2 = new Chart(ctx2, {
    type: "pie",
    data: data2,
    options: options
  });
});
Output
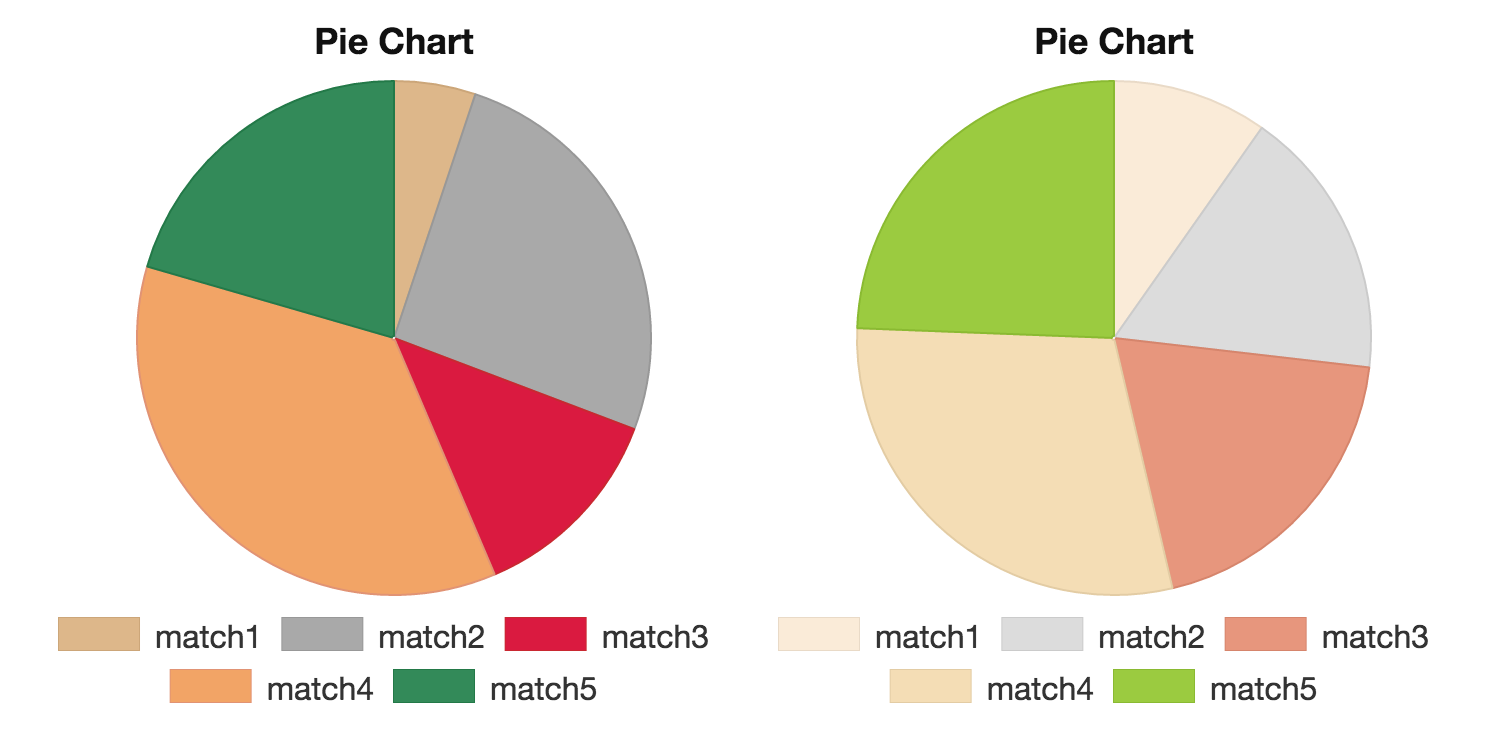
ADVERTISEMENT